画面分割
matplotlib には figure および ax という概念があります。 大雑把に言えば figure とは1個の画面 (ウィンドウ) のことで、 ax は1個の画面を分割したときの1枚1枚のことです。
そして matplotlib には「現在編集中の figure, ax」という概念があり、 plt.figure() および plt.subplot() を使えばそれぞれ figure, ax 間を移動することができます。
#!/usr/bin/env python
# -*- coding: utf-8 -*-
import matplotlib.pyplot as plt
# 1番の figure に移動
plt.figure(1)
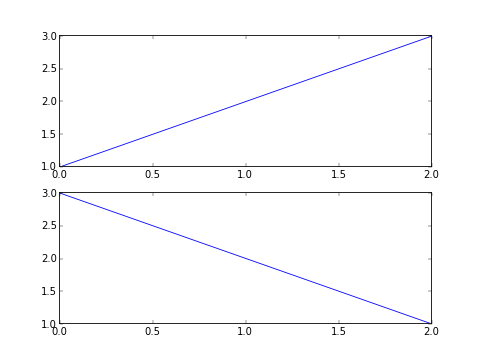
# 画面を縦2つ、横1つに分割したときの、1番目の ax に移動
plt.subplot(211)
# 1番目の ax にプロット
plt.plot([1,2,3])
# 画面を縦2つ、横1つに分割したときの、2番目の ax に移動
plt.subplot(212)
# 2番目の ax にプロット
plt.plot([3,2,1])
# 全 figure を表示
plt.show()
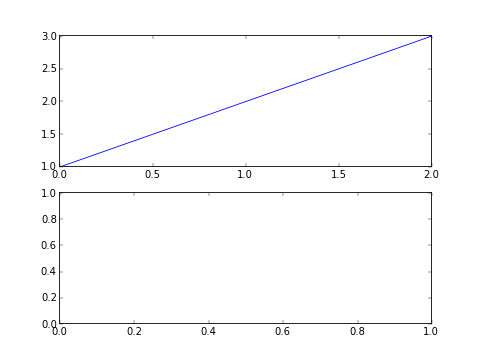
plt.gca() (gca: get current ax) を使うと現在編集中の ax を取得することができます。 取得した ax に対し plot() などのメソッドを使うことができます。
#!/usr/bin/env python
# -*- coding: utf-8 -*-

import matplotlib.pyplot as plt

# 1番の figure に移動
plt.figure(1)

# 画面を縦2つ、横1つに分割したときの、1番目の ax に移動
plt.subplot(211)

# 現在の ax を取得
ax1 = plt.gca()

# 画面を縦2つ、横1つに分割したときの、2番目の ax に移動
plt.subplot(212)

# 2番目の ax に移動したにもかかわらず、1番目の ax にプロット
ax1.plot([1,2,3])

# 全 figure を表示
plt.show()